I don’t like fish. One of my siblings had goldfish when we were kids and my daughter had a couple of tropical type fish when she was little, but I don’t like having to clean them out, and I don’t like eating fish.
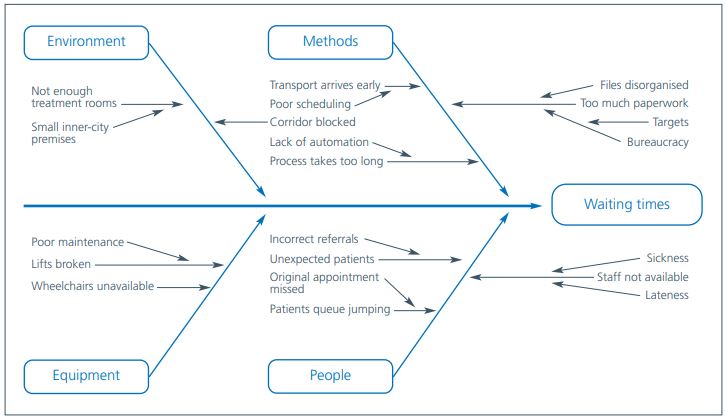
The only type of fish I do like is the Ishikawa diagram, more commonly known as the cause and effect diagram or the fishbone diagram. You can see from the image above why it has that nickname. N.B. that’s not my diagram either, just a copy of one from the NHS Quality, Service Improvement and Redesign book. This rather helpful analysis tool was invented by Professor Kaoru Ishikawa in 1968 and adopted by Dr Deming for improving quality. This diagram is credited with being one of the first tools in the quality management process.
I have never really given it much air time in the past, preferring good old SWOT or PESTLE analysis tools, however a recent problem that requires a deep dive to determine the route cause has made me dust off this fish skeleton. It is supposed to help identify why a particular problem is occurring and to identify a wider range of possible underlying factors.
To make good use of it, you need to identify the problem and consider and describe it in details, who is involved, when and where it occurs. Then you identify the major factors and draw branches off it to represent the main categories of potential underlying factors. You can then use the main categories to explore more specific factors, adding and labelling more lines off of the spine. This in turn will help you to investigate the underlying factors through other data checking methods, carrying out assessments etc. then of course you can decide how to tackle those underlying factors that are causing problems.
The particular issue I’ve started to investigate has thrown up some interesting possibilities as to what the underlying factors might be. But it has also uncovered a fundamental issue in the way we collect the data which is probably giving us a skewed result in the first place. It is plausible therefore that the issue we thought was a problem isn’t that much of a problem at all, it’s just the way we’ve been reporting it. There is still some work to do in making sure we’ve covered all the possible reasons why the data is looks like there’s a problem, but I suspect in the next month’s report the figures will be markedly different.
I have mentioned before that I’m a bit of a data nerd and do like a spreadsheet but I also like a process flow. The fishbone diagram is a nice little pictorial representation of reviewing problems and their route causes. It then feeds into the process of eliminating bottlenecks, revising processes and improving quality, efficiency and effectiveness.
There are probably other applications for adopting the fishbone method in life too.

Gosh, all looks far too complicated for my little brain 🧠😅
LikeLike